Know your margins. Don't guess.
Cost vs billable splits cleanly. Project margin % with cost, revenue, and hours. Team utilization with billable + total broken out. CSV export on every report — for the spreadsheet your CFO will inevitably ask for.
30-day free trial · No credit card · Every feature included
The five answers an agency owner asks every month.
Profitability
Project P&L: revenue, cost, margin, margin %. Sortable by any column.
Utilization
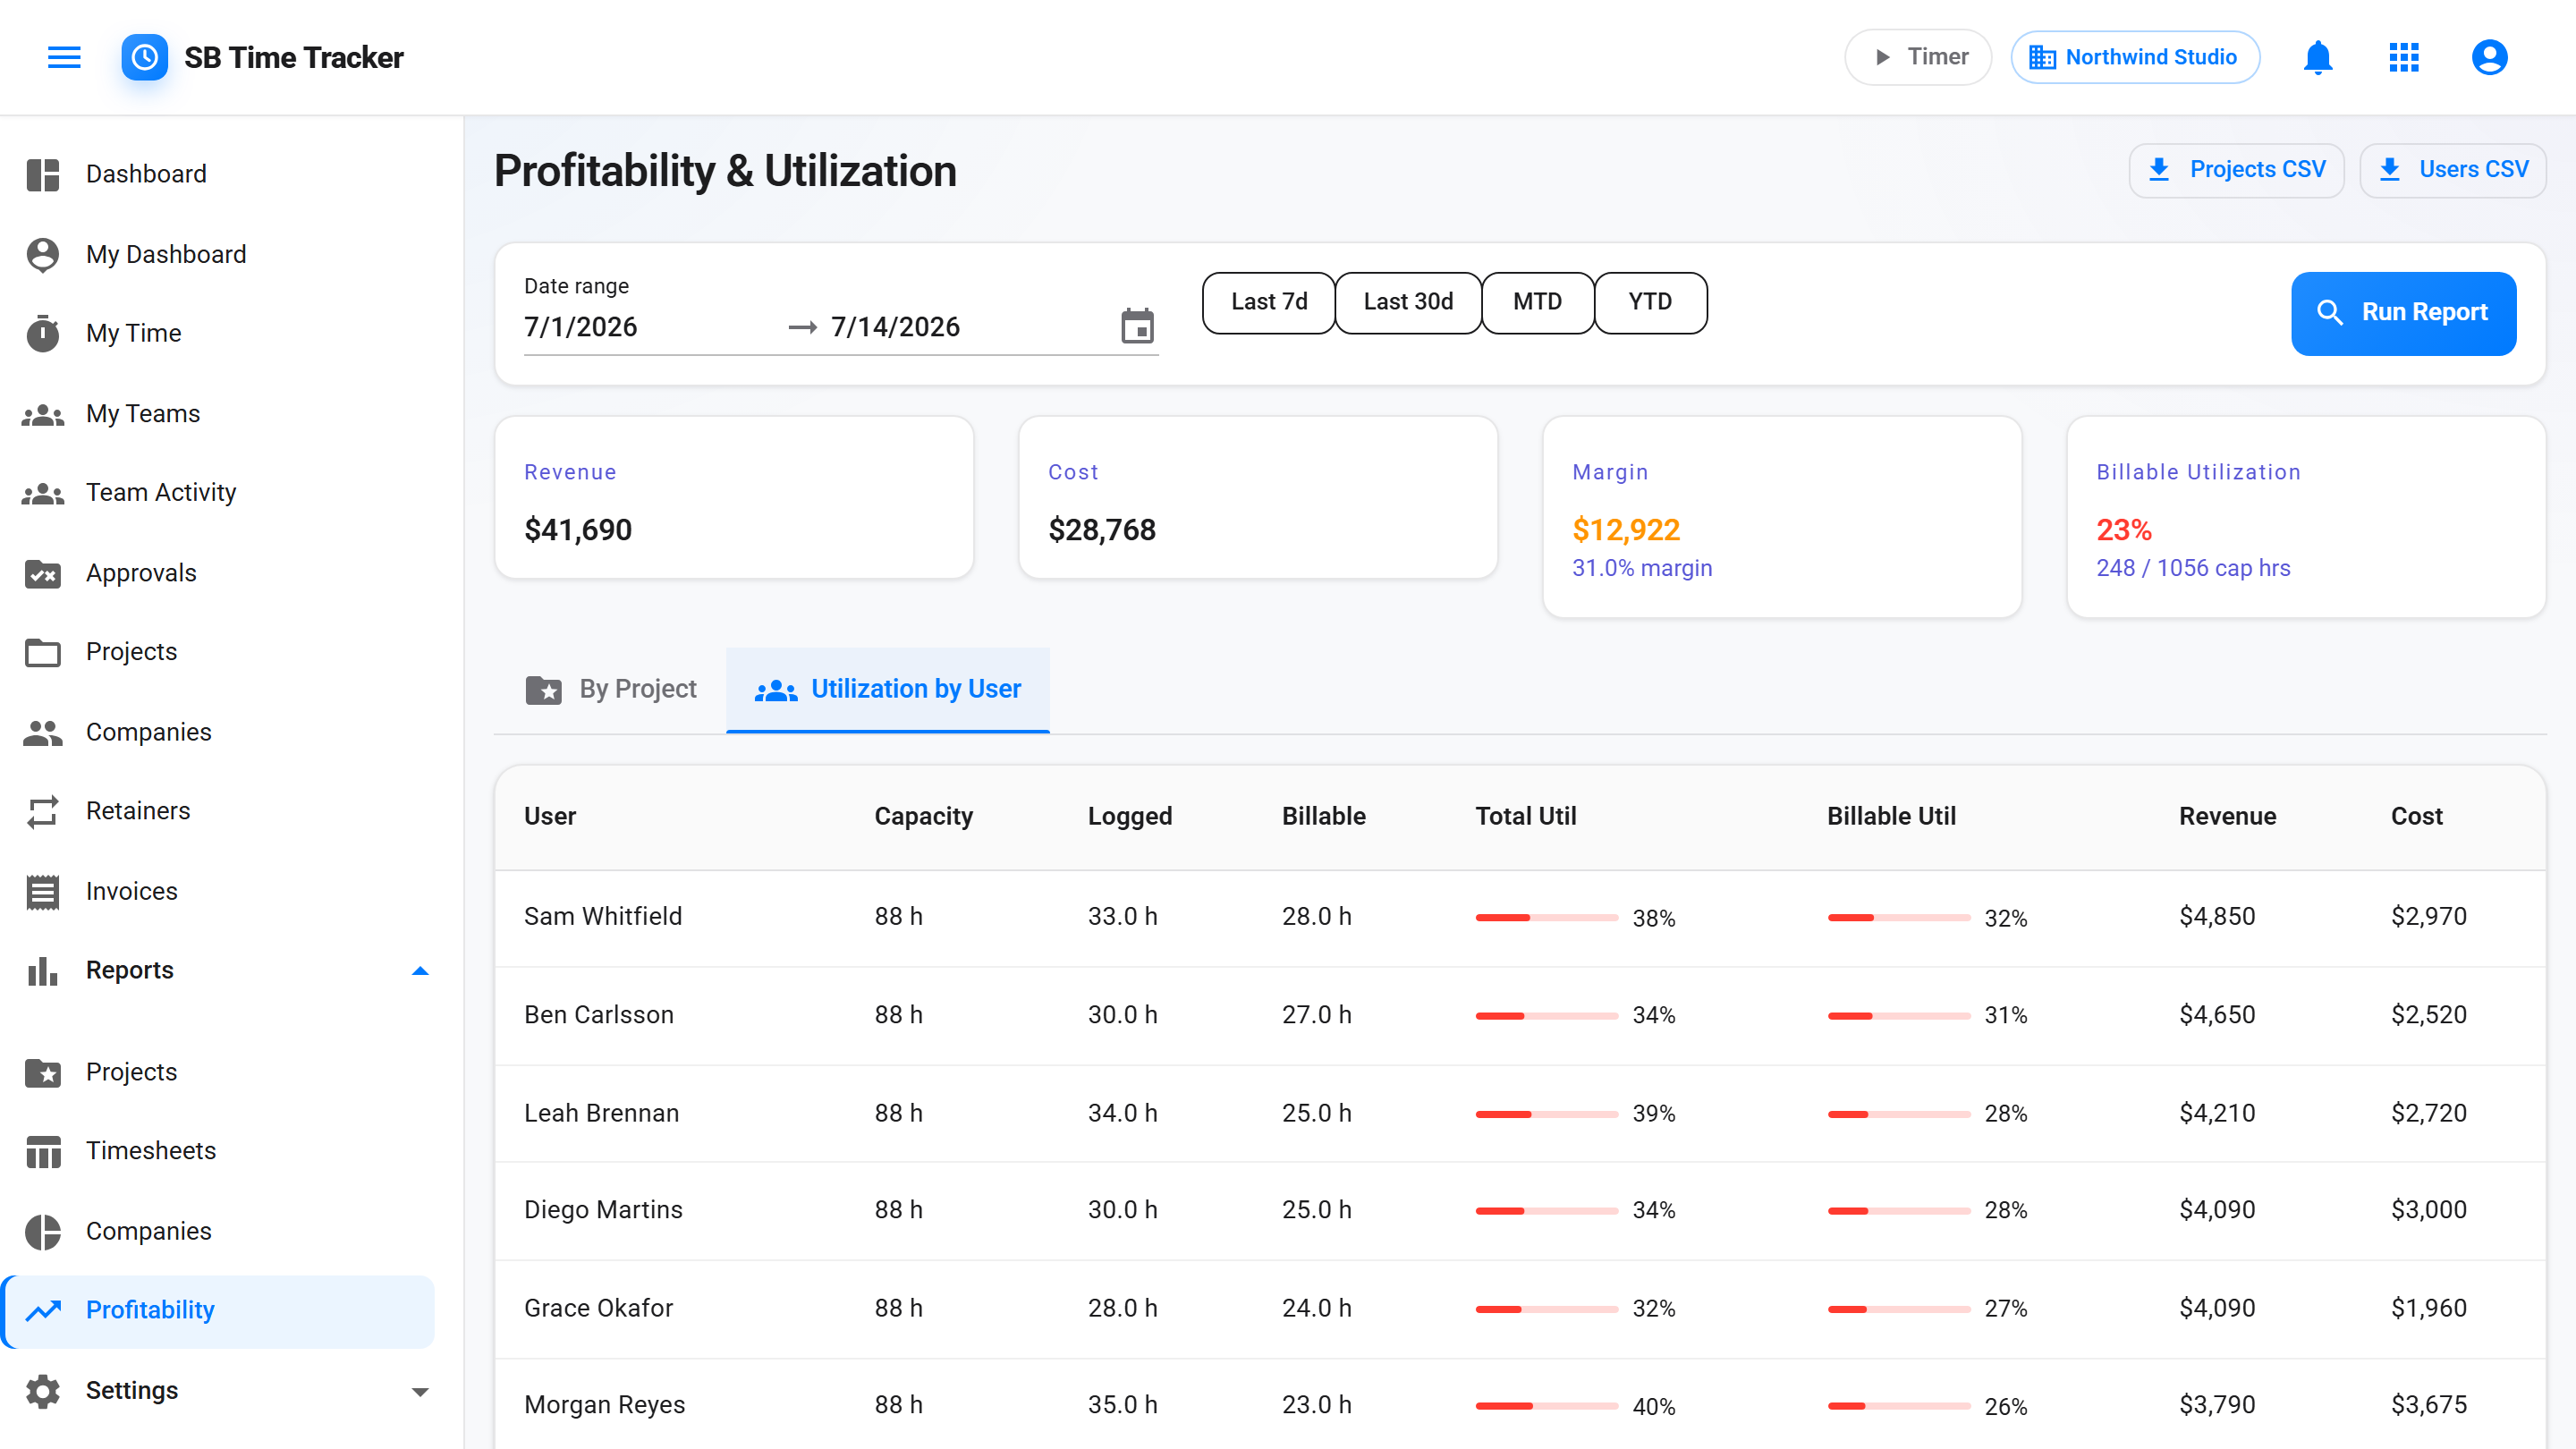
Per-user weekly utilization. Billable % and total %. Capacity-aware (40h default, override per user).
Client report
Hours and revenue by client across a date range. Drill down to project. Used to write the QBR deck.
Timesheet
Manager approval queue. Bulk approve; reject individually. Filter by user, project, status.
Audit log
Every meaningful change — who, what, when. Filter by entity type and action. Required for SOC 2 if you ever go after enterprise contracts.
Per-project P&L without a spreadsheet.
The rate hierarchy you set on projects flows automatically into this report. Revenue = billable rate × hours. Cost = cost rate × hours. Margin = revenue − cost. Margin % = margin / revenue. Sort by any column.
- Revenue, cost, margin, margin % per project
- Drill into any project for entry-level detail
- Date range filter (this month / quarter / custom)
- Money renders in your tenant's chosen display currency (any ISO 4217)
- CSV export of the full table
Who's overworked. Who has slack.
Each user has a weekly capacity (40h default, override per person). The utilization report compares logged hours against capacity, split into billable vs total. Three weeks at 110% billable on one person is a hiring signal — three weeks at 60% is a different signal.
- Weekly capacity per user (default 40h)
- Billable utilization % vs total utilization %
- Heatmap view across the team
- Per-week and per-month rollups
- CSV export for finance review
Approve a week of hours in two clicks.
Managers see a queue of pending hours grouped by user and project. Bulk approve. Reject individually (with required reason). For a trusted submitter who never clicks Submit, a manager can submit their outstanding weeks on their behalf — auto-approved and fully audited — and anyone can cut a clean line mid-week with "submit through date". Approved entries become invoice-eligible. Once invoiced, they're frozen — no retroactive edits.
- Pending queue grouped by user / project / week
- Bulk approve; reject individually
- Submit on behalf of trusted submitters — clears a backlog of open weeks in one click
- Partial-week "submit through date" for mid-cycle billing cutoffs
- Required reason on rejections
- Audit log captures every approval / rejection
- Invoiced entries auto-locked from edits
Every change, traceable.
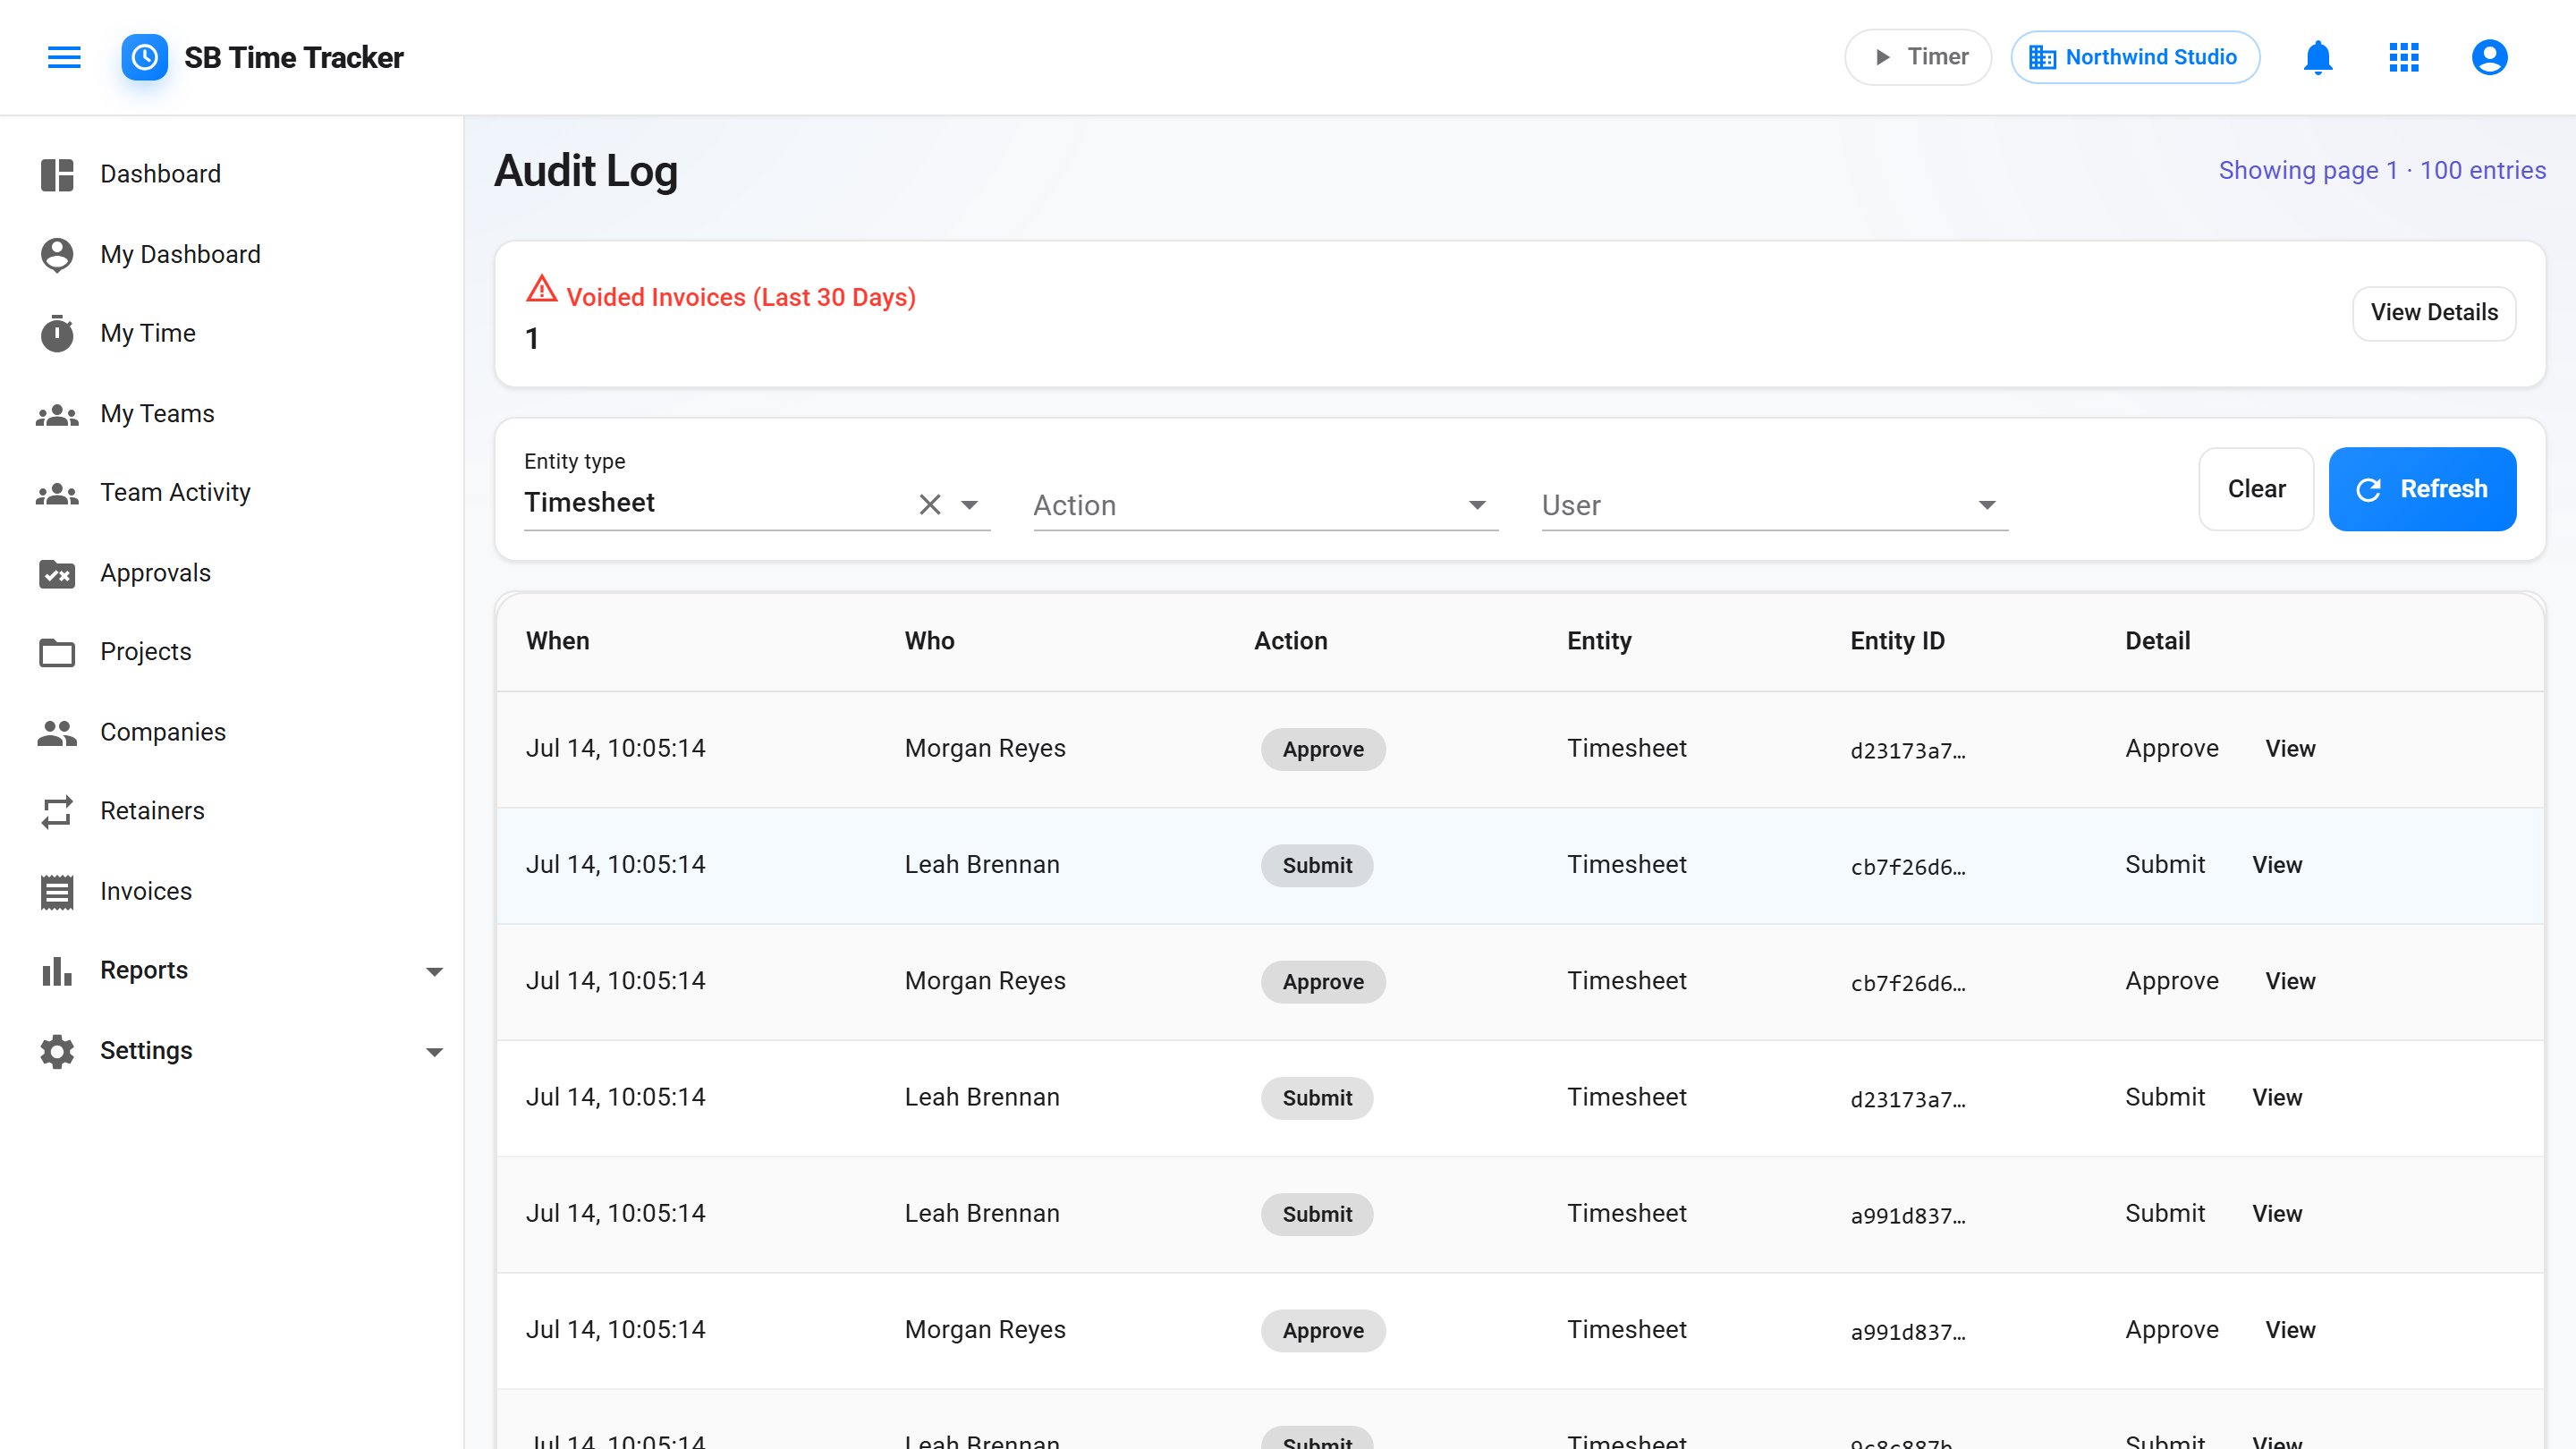
The audit log captures who created, edited, deleted, approved, invoiced — across users, projects, time entries, invoices, retainers, teams. Filter by entity, action, user, date range. Doesn't catch passive views — only state-changing events.
- Captures: created, updated, deleted, approved, invoiced, status-changed
- Filter by entity, action, user, date
- Per-tenant — never cross-tenant
- Retained as long as your tenant exists
- CSV export for compliance asks
Common questions
Can I export reports to PDF?
Today: CSV only. PDF export of reports is on the roadmap (no committed date). Browser print-to-PDF works fine in the meantime — the report layouts are print-friendly.
Can I schedule reports to email?
Not yet. The most-asked use case is "weekly utilization to me on Friday" — that's roadmap. For now you can add the report URL to a browser bookmark or use the CSV export plus your own scheduler.
Do reports include archived projects?
By default, reports cover only active projects within the date range. There's a toggle to include archived — useful for historical client comparisons.
Are utilization and profitability per-tenant?
Yes. Every report query is scoped to the current tenant — no way to see another tenant's numbers, even as SuperAdmin from a tenant-scoped page. SuperAdmin's cross-tenant view is a separate area with its own permissions.
How fresh is the data?
Real-time. Reports query MongoDB live; there's no caching layer or pre-aggregation. A time entry created 30 seconds ago shows up immediately.